What to look for when choosing an ETF
THE STACK #34With so many Exchange-Traded Funds (ETFs) out there and new ones being formed daily, how do you know the best ETF to choose?
In last week’s issue, we discussed the types of ETFs you should have in your portfolio. In today’s issue, we look at the different criteria you should assess when researching an ETF and how to pick the best ETF that suits your goal as an investor.
THE STACK
What’s the best place to research an ETF?
Fund Company’s Website
I prefer to look up details about an ETF directly on the fund company’s website.
For example, if I were researching a Vanguard ETF, I would go directly to Vanguard’s website to search for the ETF.
The fund company typically has the most up-to-date information compared to third-party websites such as Morning Star, which might have delayed updates.
ETF Facts/Factsheet
ETFs have a two to four-page PDF highlighting important details about the ETF.
These PDFs are called the ETF Facts/Fact Sheet and can be found on the fund company’s website.
Here are the key things to look for when choosing an ETF.
Goal of the fund
Each fund has a goal it seeks to accomplish. You can find this goal in the “overview” section on the ETF webpage.
Ensure the fund's goal is aligned with your investment goals and the portfolio strategy you choose.
Example: If you are looking for an ETF that tracks the Canadian equity market, ensure that the goal of the fund is to track the performance of Canadian equities.
The goal of the fund will also be indicated by its benchmark.
Benchmark
The benchmark of an ETF is a standard against which the performance of an ETF can be measured.
Most ETFs use an index as their benchmark—for example, The S&P500 index, The S&P/TSX Index, The Nasdaq Index, etc.
Net Asset Value (NAV)
The NAV is the net value of the assets in a fund, less its liabilities, divided by the total number of outstanding shares.
It is the true value of the assets contained in a fund.
Market Price
The market price is the price at which shares of an ETF can be bought or sold on the exchanges during trading hours.
The market price of an ETF is driven by supply and demand. The more investors purchase an ETF, the higher the price will be.
Index Funds trade by their NAV and are usually updated at the end of trading hours.
ETFs trade by their Market Price, which fluctuates throughout the trading day.
When researching an ETF, you must compare the NAV to the market price.
When the NAV is greater than the market price, the ETF is trading at a discount because it is selling for less than what it’s worth.
When the NAV is less than the market price, the ETF is trading at a premium because it is selling for more than its actual value.
When buying an ETF, it is ideal to purchase it at a discount, although some ETFs have high demand, making them sell at a premium.
Management Expense Ratio (MER)
The MER is the cost and fees associated with managing the assets in the fund. It is usually charged as a percentage of your portfolio's value.
The MER is taken directly out of the investment returns.
The lower the MER of an ETF, the better.
Fund Performance
The fund performance is the most important metric when researching a fund.
You should look at the fund's average return for the last ten years or since inception (whichever is shorter).
You want to focus on the long-term history of at least ten years instead of the short-term performance because it shows you how the fund has performed through various market cycles.
The ETF’s return should match your goals.
For example, when you calculated your retirement numbers, if you used an 8% rate of return to calculate the future value of your investments, then the ETFs you choose should all be above the 8% mark; otherwise, you will have less money at retirement than what you calculated.
Benchmark return vs fund return (R-squared)
Compare the return of the fund to its benchmark since inception or the last ten years, whichever is shorter.
The R-squared measures how closely the ETF has met the performance of its benchmark.
Remember, the benchmark is the standard to which the ETF is held, and if the ETF is not meeting its standard, it means that the ETF isn't performing well.
An R-square of 100 means that the ETF is meeting its benchmark, while an R-square of less than 100 indicates that the ETF has fallen below its benchmark.
Dividend/Distribution Yield
A dividend is a portion of a company’s profits passed to its shareholders.
A distribution is a combination of dividends, capital gains (from companies sold within the fund), interest and any other income made by the fund that is passed on to the shareholders.
Most ETFs pay distributions. The distributions could be paid monthly, quarterly or annually.
The 12-month distribution yield or Trailing Twelve Month (TTM) yield is the percentage of distributions the ETF paid in the last 12 months.
Distributions are an additional way that investors can make money from an ETF, so the higher the distribution yield of an ETF, the better.
Stock Exchange and Currency
Pay attention to the stock exchange that the ETF trades on. The exchange that the ETF trades on will affect the currency that the ETF trades in, which will determine foreign exchange rates and fees.
Some investors prefer to buy ETFs listed on a Canadian exchange like the TSX to avoid foreign exchange fees and rates. At the same time, some investors prefer to buy ETFs listed on a US exchange like the NYSE. These investors prefer to sock up the fees because the US dollar holds a greater value than the Canadian dollar.
Keep in mind that for tax purposes, all capital gains and dividends will be converted to and taxed in Canadian dollars based on the Bank of Canada rate as of the date you sold your investments (based on the type of registered account you hold your investments in).
Holdings
Look at the companies held inside the ETF.
The top ten holdings usually determine the performance of the fund. The stronger the top ten holdings, the better the ETF will perform.
Ensure that you do not pick two ETFs with the same top ten holdings.
Geographical Region/Country
What is the main geographic region of the companies held inside the ETF? Is it your home country, international or a combination of different regions?
The geographic region should align with your portfolio strategy.
Age of the fund
Look for the fund's inception date. The older the fund, the more history it has, and you can track its performance through various market cycles.
Knowing the age of the fund makes it easier to make a judgment call because you have long-term data compared to a new fund, where you don’t have enough historical data to tell you if the fund will perform well over time.
Tying it all together
When comparing two or more ETFs, to make a fair comparison, they should all have a similar goal or benchmark.
For example, you should compare multiple ETFs that all track the S&P 500. You shouldn’t compare an S&P500 ETF to a TSX ETF.
Knowing which criteria to prioritize is vital.
For example, there might be an ETF with a slightly higher MER of 0.02%, but it might have a better return that is 1.76% higher. So even though this ETF has a higher MER, because it has much better returns, that makes it the better choice.
THE TOOL
I love the comparison tool from Vanguard that allows you to compare multiple ETFs at the same time.
My 1:1 clients use it all the time, and it makes researching your ETFs a breeze because it collates all the key information you need.
Always verify the data on the fund company’s website, as sometimes, the updates could be delayed.
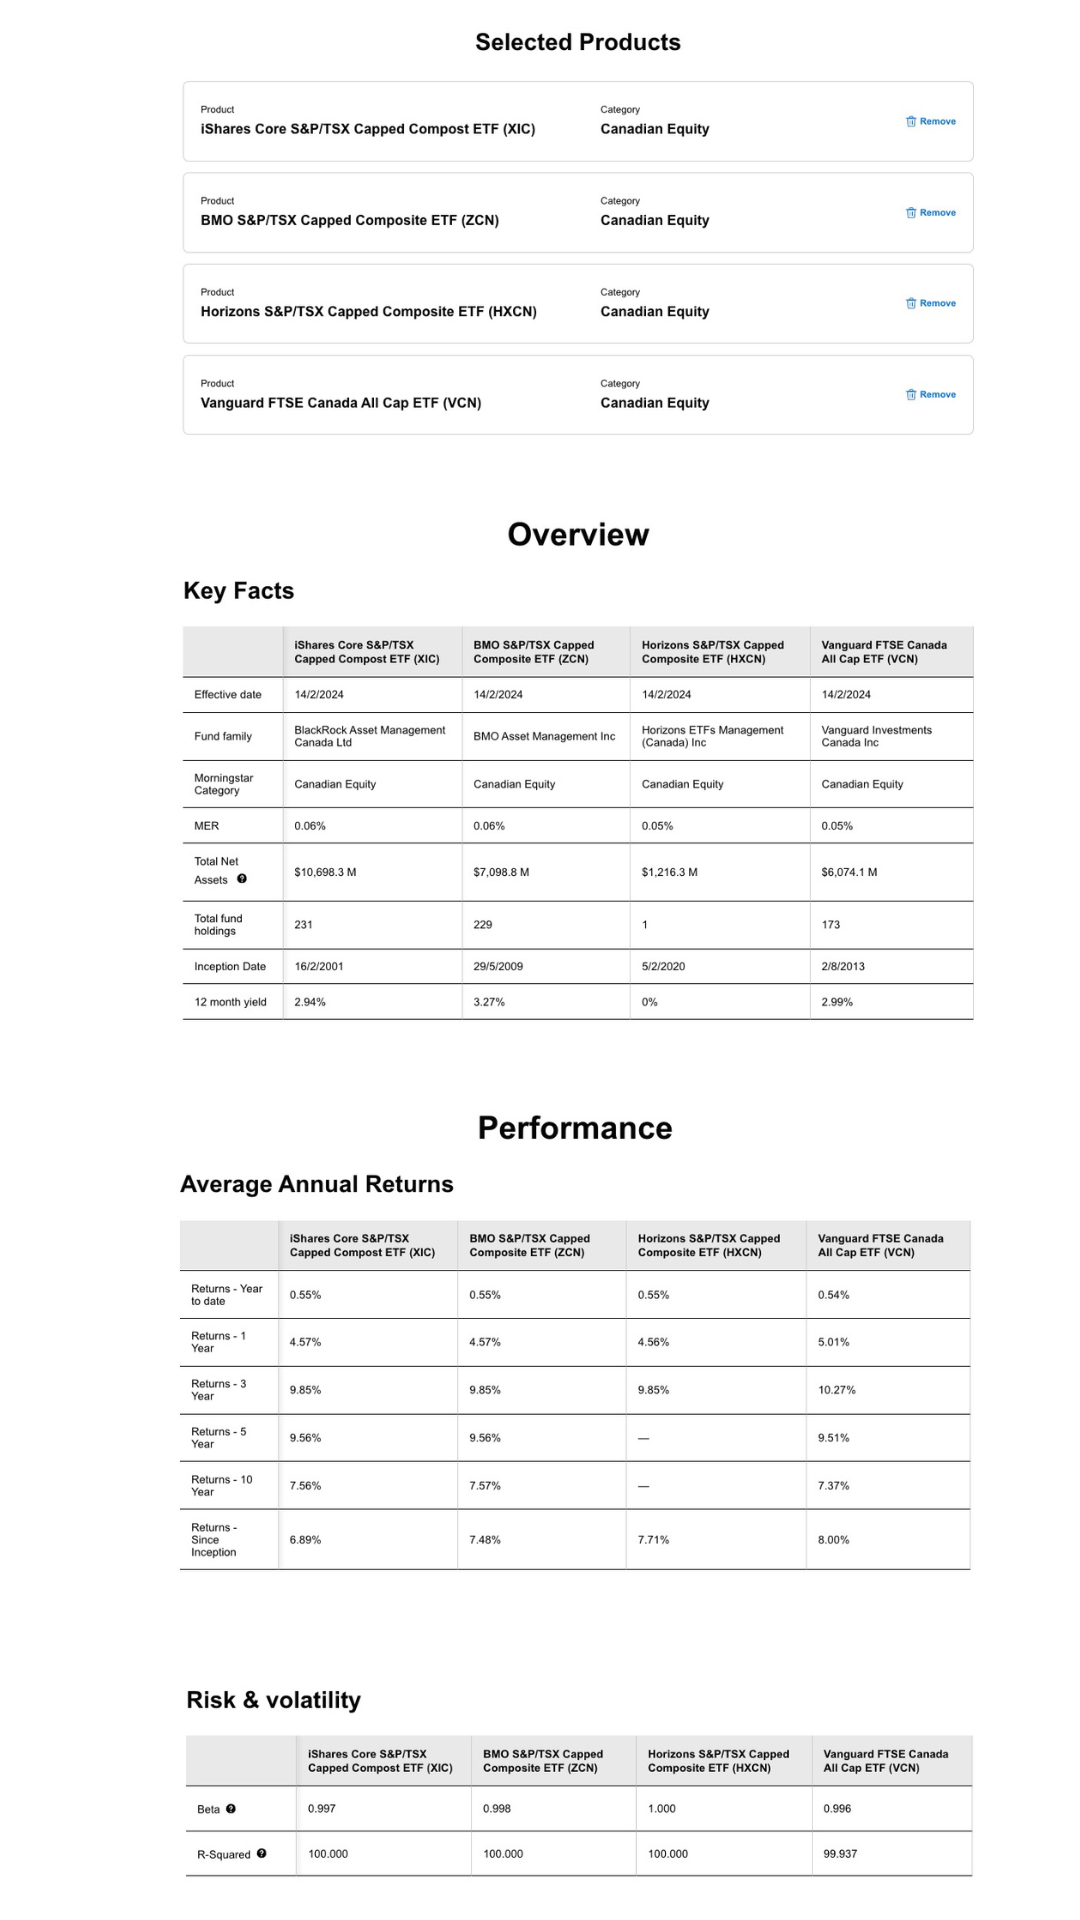
THE ACCOUNTABILITY
Using the list of ETFs from last week, compare the four ETFs in each category using the criteria we just learned and the comparison tool above. Choose the best ETF from each category and purchase your ETFs!
At the end of this exercise, you should have purchased one ETF from each of these categories:
Canadian Total Stock Market ETF
US Total Stock Market ETF
International Stock Market ETF
Fixed Income ETF
THE COURAGE
THE KNOWLEDGE
FTSE
FTSE is short for Financial Times Stock Exchange. It was formed by two companies - The Financial Times and the London Stock Exchange. It is now known as the FTSE Russell Group.
The FTSE is a company that creates several indexes/benchmarks, such as:
FTSE 100 Index, which is used to track the performance of the UK market.
FTSE Nasdaq 500, which is used to track the Nasdaq exchange, which contains the top technology companies worldwide.
S&P
S&P is short for Standard and Poor. It was formed by two data publication companies - Henry Varnum Poor and The Standard Statistics Bureau.
The S&P is a leading index provider which has created several indexes, such as:
S&P 500, which tracks the 509 largest companies in the US.
S&P/TSX, which tracks 250 of the largest companies in Canada.
MSCI
MSCI is short for Morgan Stanley Capital International.
The MSCI is a company that provides investment data and analytical services to investors and has created several indexes, such as:
MSCI All Country World Index (MSCI ACWI), which includes nearly 3,000 stocks from 47 global markets.
MSCI Emerging Markets, which includes large and medium-cap companies from 25 up-and-coming nations.
Whenever you see the letter FTSE, S&P or MSCI in an ETF description, it simply refers to the company that created the benchmark the ETF tracks.
Keep Stacking!


about the newsletterEvery Saturday, subscribers will receive one money tip, one tool, one actionable step, one word of courage and learn a new finance term to help you gain control of your finances in less than five minutes.
Free resources
Keep reading the latest NEWSLETTERS

How to cycle sync your finances